Contents
Executive Summary
1.1 Background
1.2 Project Description
1.3 Purpose of the Baseline Monitoring Report for SENTX
1.4 Structure of the Baseline Monitoring Report for SENTX
2.1 Monitoring Requirement
2.2 Monitoring Equipment
2.3 Monitoring Locations
2.4 Monitoring Parameters, Frequency and Duration
2.5 Monitoring Methodology
2.6 Weather Data
2.7 Baseline Monitoring Results
2.8 Action and Limit Level
2.9 Event and Action Plan
3 Noise
3.1 Monitoring Requirement
3.2 Monitoring Equipment
3.3 Monitoring Locations
3.4 Monitoring Parameters, Frequency and Duration
3.5 Monitoring Methodology
3.6 Maintenance and Calibration
3.7 Baseline Monitoring Results
3.8 Action and Limit Levels
3.9 Event and Action Plan
4.1 Monitoring Requirement
4.2 Monitoring Equipment
4.3 Monitoring Locations
4.4 Monitoring Parameters and Frequency
4.5 Monitoring Methodology
4.6 QA/QC Requirements
4.7 Baseline Monitoring Results
4.8 Action and Limit Levels
4.9 Event and Action Plan
5.1 Monitoring Requirement
5.2 Monitoring Methodology
5.3 Monitoring Results
5.4 Summary
ANNEXES
Annex A Air Quality
Annex A1 Calibration Certificates for Dust Monitoring Equipment
Annex A2 Wind Data from on-site meteorological monitoring station at existing SENT landfill
Annex A3 24-Hour TSP Monitoring Results
Annex A4 Graphical Presentation of 24-Hour TSP Monitoring Results
Annex B Noise
Annex B1 Calibration Certificates for Noise Monitoring Equipment
Annex B2 Baseline Monitoring Schedule
Annex B3 Noise Monitoring Results
Annex B4 Graphical Presentation of Noise Monitoring Results
Annex C Surface Water Quality
Annex C1 Calibration Certificates for surface Water Quality Monitoring Equipment
Annex C2 surface Water Quality Monitoring Results
Annex C3 Graphical Presentation of surface Water Quality Monitoring Results
Annex C4 CATCHMENT
AREA OF DP3 WITH TENTATIVE CONSTRUCTION PROGRAMME
Annex D Landscape and Visual
Annex D1 Updated Baseline Conditions of the Landscape Resources
Annex D2 Updated Baseline Conditions of the Landscape Character Areas
Executive Summary
The SENT Landfill Extension (SENTX) forms an integral part in the Strategic Plan in maintaining the continuity of landfill capacity in the Hong Kong for the cost-effective and environmentally satisfactory disposal of waste. ERM-Hong Kong, Limited (ERM) is commissioned to undertake the role of Environmental Team (ET) for the construction, operation/restoration and aftercare of SENTX Project (“the Project”) in accordance with the requirements specified in the Environmental Permit (EP), updated Environmental Monitoring and Audit (EM&A) Manual, the approved Environmental Impact Assessment (EIA) Report of the Project taking account of the latest design and other relevant statutory requirements.
In accordance with the updated EM&A Manual of the Project, baseline monitoring was undertaken for the Project prior to commencement of the construction works. In accordance with the updated EM&A Manual, the baseline monitoring covered the following components:
Ÿ Air Quality (construction dust is the key concern during the construction phase);
Ÿ Noise;
Ÿ Surface water Quality; and
Ÿ Landscape and Visual.
Dust monitoring was conducted at two monitoring stations (DM1 and DM2) under the on-going EM&A programme TKO Area 137 Fill Bank. The recent one year historical data taking account of the seasonal variations are considered representative to the ambient air quality conditions of the air sensitive receivers in the vicinity of the Project. The Action and Limit Levels for dust (in term of 24-hour Total Suspended Particulate (TSP) levels) were therefore established based on the recent one year monitoring results.
Baseline noise monitoring was conducted at two monitoring stations (NM1 and NM2) between 24 August and 10 September 2018. The major noise sources identified near the monitoring stations are the noise from the operation of the existing SENT landfill and insect. The baseline noise monitoring results are considered representative of the current ambient noise level.
There are two surface water quality monitoring stations (DP3 and DP4). Baseline surface water quality monitoring was conducted at DP4 between 6 August and 31 August 2018. Baseline surface water quality monitoring for DP3 will be conducted prior to the scheduled commencement of the SENTX construction works affecting DP3 by 2021. Site clearance works were observed downstream of the DP4 sampling point during some monitoring events. These works were being undertaken by the TKO Area 137 Contractor in an area of the site still to be handed over to GVL. Considered the limited scale and location of the works, the impact on the surface water quality samples is anticipated to be insignificant. The baseline surface water monitoring results are thus considered representative of the current ambient surface water quality levels. Action and Limit Levels for dissolved oxygen (DO), suspended solids (SS) and pH were established based on the baseline monitoring results.
Site conditions verification surveys for landscape and visual baseline were conducted in August and September 2018 to revisit the identified Landscape Resources (LRs) and Landscape Character Areas (LCAs) in the approved EIA Report. The survey results concluded that the landscape and visual baseline conditions is similar to those presented in the approved EIA Report, except LR14 and LR16. The observed deviations at LR14 and are considered minor and do not significantly alter the overall landscape and visual baseline condition. Additional landscape and visual mitigation measures other than those recommended in the approved EIA Report are thus not required.
1
Introduction
1.1
Background
The SENT Landfill Extension (SENTX) forms an integral part in the Strategic Plan in maintaining the continuity of landfill capacity in the Hong Kong for the cost-effective and environmentally satisfactory disposal of waste. The Environmental Impact Assessment (EIA) Report and the associated Environmental Monitoring and Audit (EM&A) Manual for the construction, operation, restoration and aftercare of the SENTX (hereafter referred to as “the Project”) have been approved under the Environmental Impact Assessment Ordinance (EIAO) in May 2008 (Register No.: AEIAR-117/2008) (hereafter referred to as the approved EIA Report) and an Environmental Permit (EP-308/2008) (EP) was granted by the Director of Environmental Protection (DEP) on 5 August 2008.
Since then, applications for Variation of an Environmental Permit (No. VEP-531/2017) were submitted to EPD and the Variation of Environmental Permits (EP-308/2008/A and EP-308/2008/B) were granted on 6 January 2012 and 20 January 2017, respectively, as the Hong Kong SAR Government has decided to reduce the scale of the design scheme of SENTX assessed in the approved EIA Report and SENTX will only receive construction waste. In line with the changes proposed by EPD, the landfill contractor for SENTX, Green Valley Landfill Limited (GVL), has developed a final scheme for SENTX (hereafter “the latest design”) in 2016. This latest design complies with the requirements in the Technical Memorandum of the Environmental Impact Assessment Process (EIAO-TM) and the current EP (EP-308/2008/B) conditions. A Further Environmental Permit (FEP-01/308/2008/B) (FEP) was granted to GVL on 16 May 2018.
ERM-Hong Kong, Limited (ERM) and Meinhardt Infrastructure and Environment Limited (Meinhardt) are commissioned to undertake the roles of Environmental Team (ET) and the Independent Environmental Checker (IEC), respectively, to undertake the EM&A activities for the Project in accordance with the requirements specified in the EP, updated EM&A Manual ([1]), approved EIA Report ([2]) taking account of the latest design and other relevant statutory requirements.
1.2
Project Description
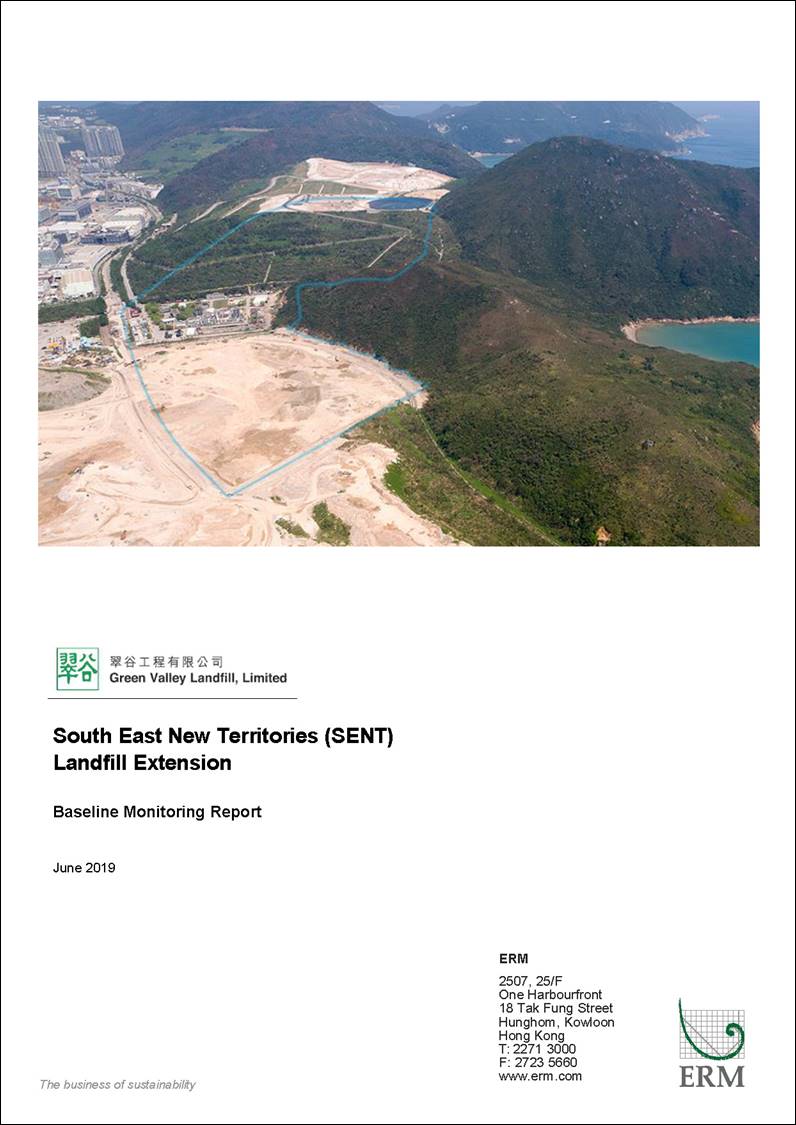
The SENTX is a piggyback landfill, occupying the southern part of the existing SENT Landfill (including its infrastructure area) and 13 ha of Tseung Kwan O (TKO) Area 137. A layout plan of the SENTX is shown in Figure 1.1. Under the latest design, the SENTX has a net void capacity of about 6.5 Mm3 and provides an additional lifespan of about 6 years, commencing operation upon exhaustion of the SENT Landfill. The SENTX will receive construction waste only.
The key elements of the construction, operation/restoration and aftercare of the SENTX are described below.
Construction of SENTX
Construction works will commerce about two years prior to the operation of the SENTX. The major construction works includes:
· Site formation at the TKO Area 137 and the existing infrastructure area at SENT Landfill;
· Construction of surface and groundwater drainage systems;
· Construction of the leachate containment and collection systems;
· Construction of new leachate and landfill gas treatment facilities, site offices, maintenance yards at the new infrastructure area;
· Construction of new pipelines to transfer the leachate and landfill gas collected from the existing SENT Landfill to the treatment facilities at the new infrastructure area;
· Construction of the site access and new waste reception facilities; and
· Demolition of the facilities at the existing SENT Landfill infrastructure area.
Operation and Restoration of SENTX
The leachate and landfill treatment facilities will be commissioned and the first phase of the SENTX will start operation upon exhaustion of the SENT Landfill. Construction of the leachate containment and collection system for the subsequent phases will continue while the first phase of the SENTX is in operation. The areas that reach the finished profile will be progressively restored and landscaped.
Aftercare of SENTX
Upon the completion of final filling and restoration, the aftercare of the SENTX will begin and last for 30 years. Regular site maintenance, collection and treatment of landfill gas and leachate will be undertaken during the aftercare period to ensure that the landfill complies with the required environmental performance requirements and is safe. The restored landfill may then be developed for various passive beneficial uses (e.g. open spaces, walking trails, etc.).
Implementation Programme
The key implementation milestones of the Project are indicatively summarised in Table 1.1.
Table 1.1 Estimated Key Dates of Implementation Programme
|
Key Stage of the Project |
Indicative Date |
|
Start construction |
Q4 2018 |
|
Commissioning of new infrastructure facilities |
2020 |
|
Demolition of existing infrastructure facilities |
2021 |
|
Start waste intake at SENTX |
2021 or upon exhaustion of SENT Landfill |
|
Stop taking waste at SENTX |
2027 |
|
End of aftercare for SENTX |
2057 |
1.3
Purpose of the Baseline
Monitoring Report for SENTX
The purpose of this Baseline Monitoring Report for SENTX development is to present the baseline levels of air quality, noise and surface water quality at the designated monitoring locations around the Project area prior to the commencement of construction works. In addition, landscape and visual baseline monitoring was undertaken to verify the site conditions with reference to the approved EIA Report taking account of the latest design. Such baseline conditions will be used as the basis for assessing environmental impacts, if any, and compliance monitoring during the construction phase of the Project.
Under the requirement of Condition 3.3 of the FEP, the Baseline Monitoring Report shall be prepared and submitted to the DEP at least two weeks before the commencement of construction of the Project.
1.4
Structure of the Baseline
Monitoring Report for SENTX
The remainder of the Baseline Monitoring Report for SENTX is structured as follows:
· Section 2 presents the methodology and findings of the baseline air quality monitoring;
· Section 3 presents the methodology and findings of the baseline noise monitoring;
· Section 4 presents the methodology and findings of the baseline surface water quality monitoring;
· Section 5 presents the methodology and findings of the baseline landscape and visual monitoring; and
· Section 6 summarises the baseline monitoring events.
2
Air Quality
2.1
Monitoring Requirement
According to the updated EM&A Manual of the Project, baseline air quality monitoring (dust, in term of Total Suspended Particulates (TSP)) shall be carried out at the two designated monitoring locations (i.e. DM1 and DM2). As there are two existing TSP monitoring stations (i.e. TKO-A1 and TKO-A2a) currently operating by the Civil Engineering and Development Department (CEDD) to monitor the 24-hour TSP levels at the proposed dust monitoring stations for the SENTX, it is considered that the CEDD monitoring data can represent the baseline dust condition before the construction of the SENTX. The recent one year historical data at a 6-day interval prior to commencement of the construction works for the Project, taking into account of the seasonal variation, monitored by the two existing CEDD’s monitoring stations were used to establish the baseline dust levels for construction phase. Details of the baseline air quality monitoring are presented in the following sections.
2.2
Monitoring Equipment
High volume air samplers (HVSs) in compliance with the specifications listed under Section 3.2.2 of the updated EM&A Manual were used to measure 24-hour TSP levels at the CEDD dust monitoring stations. The HVSs were calibrated upon installation and thereafter at bi-monthly intervals to check the validity and accuracy of the results.
Table 2.1 summarises the equipment used in the baseline dust monitoring programme. Copies of the calibration certificates for the equipment are presented in Annex A1.
Table 2.1 Dust Monitoring Equipment
|
Equipment |
Monitoring Station |
Model |
|
HVSHVS |
DM1 |
Greasby 105 (S/N: 9795 (ET/EA/003/18)) |
|
DM2 |
Andersen G1051 (S/N: 1176 (ET/EA/003/05)) |
|
|
Calibrator |
All Station |
Tisch TE-5025A (S/N: 3297 & 3480) |
2.3
Monitoring Locations
Baseline dust monitoring for the Project was conducted at two monitoring stations at air sensitive receivers (ASRs) (i.e. DM1 and DM2). Locations of the two monitoring stations are shown in Figure 2.1.
2.4
Monitoring Parameters,
Frequency and Duration
The monitoring parameters and frequency of baseline dust monitoring are presented in Table 2.2.
Table 2.2 Frequency and Parameters of Baseline Dust Monitoring
|
Monitoring Station |
Location |
Parameter |
Frequency and Duration |
|
DM1 |
Site Egress of TKO Area 137 Fill Bank |
24-hour TSP |
Once every 6 days of the recent 1 year |
|
DM2 |
Combined Reception and Exit Office (CREO) of TKO Area 137 Fill Bank |
2.5
Monitoring Methodology
The 24-hour TSP levels were measured by the HVSs in accordance with procedures specified in the Manufacturer’s Instruction Manual. The procedures are described as follows:
Ÿ Prior to the commencement of the dust sampling, set the flow rate of the HVSs (between 0.6m3 /min and 1.7m3 /min.);
Ÿ Use fiberglass filters (Whatman G653) for TSP sampling;
Ÿ Check the power supply to ensure the sampler works properly;
Ÿ On sampling, operate the sampler for 5 minutes to establish thermal equilibrium before placing any filter media at designated air monitoring station;
Ÿ Remove the filter holding frame by loosening the four nuts and carefully center a weighted and conditioned filter with the stamped number upwards, on a supporting screen;
Ÿ Align the filter on the screen so that the gasket forms an air-tight seal on the outer edges of the filter and tighten the filter holder frame to the filter holder with swing bolts. The applied pressure should be sufficient to avoid air leakage at the edges;
Ÿ Set the programmable timer for a sampling month of 24 hours. Record the information on the record sheet, which includes the starting time, the weather condition and the filter number (the initial weight of the filter paper can be found out by using the filter number);
Ÿ After sampling, transfer the filter from the filter holder of the sampler to a sealed plastic bag and send to the laboratory for weighting. The elapsed time is also recorded; and
Ÿ Before weighting, equilibrate all filters in a desiccator for 24 hours with the temperature of 25°C ± 3°C and the relative humidity of <50% ± 5%.
2.6
Weather Data
Wind data obtained from the on-site meteorological monitoring station at the existing SENT landfill were used for the dust monitoring and are shown in Annex A2. It is considered that wind data obtained at the existing the on-site meteorological monitoring station are representative of the Project area and could be used for the baseline and construction phase dust monitoring programme for the Project.
2.7
Baseline Monitoring Results
The results of the recent one year historical dust data at two monitoring locations (DM1 and DM2) between July 2017 to June 2018 are summarised in Table 2.3. The detailed 24-hour TSP monitoring results are presented in Annex A3. Graphical presentations of the 24-hour TSP results at each monitoring location are shown in Annex A4. The operations of the existing SENT landfill and the TKO Area 137 Fill Bank are identified as the influencing factors which may affect the results of baseline monitoring.
Table 2.3 Summary of Baseline 24-hour TSP Monitoring Results
|
Monitoring Station |
Average 24-hr TSP Concentration (µg m-3) (Range in bracket) |
|
DM-1 – Site Egress of TKO Area 137 Fill Bank |
113 (27 - 207)
|
|
DM-2A –Combined Reception and Exit Office (CREO) of TKO Area 137 Fill Bank |
97 (31 - 185) |
2.8
Action and Limit Level
Guidelines for establishing the Action and Limit Levels for dust monitoring during the construction of the Project are presented in Table 2.4.
Table 2.4 Guidelines for Establishing Action and Limit Levels for Dust
|
Parameters |
Action Level |
Limit Level |
|
24-hour TSP Level |
For baseline level ≤ 200 µg m-³, Action level = (Baseline level *1.3 + Limit level)/2
For baseline level > 200 µg m-³, Action level = Limit level |
260 µg m-³ |
The Action and Limit Levels of 24-hr TSP levels for dust impact monitoring at each monitoring station are determined and presented in Table 2.5.
Table 2.5 Action and Limit Levels for 24-hour TSP
|
Monitoring Station |
Action Level |
Limit Level |
|
DM-1 – Site Egress of TKO Area 137 Fill Bank
|
204 µg m-³ |
260 µg m-³ |
|
DM-2A –Combined Reception and Exit Office (CREO) of TKO Area 137 Fill Bank |
193 µg m-³ |
260 µg m-³ |
2.9
Event and Action Plan
Should non-compliance of the air quality criteria occur, actions in accordance with the Event and Action Plan in Table 2.6 shall be carried out.
Table 2.6 Event / Action Plan for Dust Monitoring During Construction Phase
|
Action |
||||
|
Event |
ET |
IEC |
Contractor |
|
|
Action Level |
|
|
|
|
|
Exceedance for one sample
|
· Identify the source(s) and investigate the cause(s) of exceedance · Prepare Notification of Exceedance within 24 hours · Inform Contractor, IEC and Project Proponent whether the cause of exceedance is due to the Project · Repeat measurement to confirm finding if exceedance is due to the Project · Increase monitoring frequency to daily if exceedance is due to the Project and continue until the monitoring results reduce to below action level
|
· Verify the Notification of Exceedance · Check monitoring data submitted by ET · Check Contractor's working methods
|
· Rectify any unacceptable practice · Amend working methods if appropriate
|
|
|
Exceedance for two or more consecutive samples
|
· Identify the source(s) and investigate the cause(s) of exceedance · Prepare Notification of Exceedance within 24 hours · Inform Contractor, IEC and Project Proponent whether the cause of exceedance is due to the Project · Discuss with Contractor and IEC for remedial measures required · Ensure remedial measures are properly implemented · If exceedance continues, arrange meeting with Contractor & IEC · Continue monitoring at daily intervals if exceedance is due to the Project · If no exceedance for 3 consecutive days, cease additional monitoring
|
· Verify the Notification of Exceedance · Check monitoring data submitted by ET · Check Contractor's working methods · Discuss with ET and Contractor on proposed remedial measures · Review proposals on remedial measures · Audit the implementation of the remedial measures · Audit the effectiveness of the implemented remedial measures |
· Submit proposals for remedial measures to IEC · Implement the agreed proposals · Amend proposal if appropriate
|
|
|
Limit Level |
|
|
|
|
|
Exceedance for one sample
|
· Identify the source(s) and investigate the cause(s) of exceedance · Prepare Notification of Exceedance within 24 hours · Inform Contractor, IEC, Project Proponent and EPD whether the cause of exceedance is due to the Project · Discuss with Contractor and IEC for remedial measures required · Ensure remedial measures are properly implemented · Repeat measurement to confirm finding if exceedance is due to the Project · Increase monitoring frequency to daily if exceedance is due to the Project and continue until the monitoring results reduce to below limit level
|
· Verify the Notification of Exceedance · Check monitoring data submitted by ET · Check Contractor's working methods · Discuss with ET and Contractor on proposed remedial measures · Review proposals on remedial measures · Audit the implementation of the remedial measures · Audit the effectiveness of the implemented remedial measures |
· Take immediate action to avoid further exceedance · Submit proposals for remedial measures to IEC · Implement the agreed proposals · Amend proposal if appropriate
|
|
|
Exceedance for two or more consecutive samples |
· Identify source(s) and investigate the cause(s) of exceedance · Prepare Notification of Exceedance within 24 hours · Inform Contractor, IEC, Project Proponent and EPD the causes & actions taken for the exceedances · Discuss with Contractor and IEC for remedial measures required · Ensure remedial measures are properly implemented · Continue monitoring at daily intervals if exceedance is due to the Project · If no exceedance for 3 consecutive days, cease additional monitoring · If exceedance due to the Project continues, consider what portion of the work is responsible and stop that portion of work until the exceedance is abated
|
· Verify the Notification of Exceedance · Check monitoring data submitted by ET · Check Contractor's working methods · Discuss with ET and Contractor on proposed remedial measures · Review proposals on remedial measures · Audit the implementation of the remedial measures · Audit the effectiveness of the implemented remedial measures |
· Take immediate action to avoid further exceedance · Submit proposals for remedial measures to IEC · Implement the agreed proposals · Resubmit proposals if problem still not under control
|
|
3
Noise
3.1
Monitoring Requirement
According to the updated EM&A Manual of the Project, baseline noise monitoring shall be carried out at the monitoring locations (i.e. NM1 and NM2) for a continuous period of at least 14 consecutive days at a minimum logging interval of 30 minutes for daytime between 07:00 and 19:00 hrs of normal weekdays. The noise levels shall be measured in terms of A-weighted levels Leq, L10 and L90 at the specified interval. Details of the baseline noise monitoring are presented in the following sections.
3.2
Monitoring Equipment
Integrating Sound Level Meter was used for noise monitoring. The meter is a Type 1 sound level meter capable of giving a continuous readout of the noise level readings including equivalent continuous sound pressure level (Leq) and percentile sound pressure level (Lx). The sound level meters and calibrators used should comply with the International Electrotechnical Commission (IEC) Publication 651 : 1979 (Type 1) and 804 : 1985 (Type 1) specification as stated in the Technical Memorandum on Noise from Construction Work other than Percussive Piling (GW-TM) and Technical Memorandum on Noise From Places Other than Domestic Premises, Public Places or Construction Sites (IND-TM). The sound level meters have also used the manufacturers recommended wind shield. The noise monitoring equipment used is presented in Table 3.1 and copies of the calibration certificates for the sound level meters and calibrator are presented in Annex B1.
Table 3.1 Noise Monitoring Equipment
|
Equipment |
Monitoring Station |
Model |
|
Sound Level Meter |
NM1 |
Brüel & Kjær 2238 (S/N: 2285722) |
|
NM2 |
Brüel & Kjær 2238 (S/N: 2285762) |
|
|
Calibrator |
All Stations |
Quest QC-20 (S/N: QO9090006) |
3.3
Monitoring Locations
Baseline noise monitoring for the Project was conducted at two monitoring stations around the Project area (i.e. NM1 and NM2). Locations of the two monitoring stations are shown in Figure 2.1.
3.4
Monitoring Parameters,
Frequency and Duration
The monitoring parameters and frequency of baseline noise monitoring are presented in Table 3.2.
Table 3.2 Frequency and Parameters of Baseline Noise Monitoring
|
Monitoring Station |
Location |
Frequency |
Parameter |
|
NM1 |
SENTX Site Boundary (North)
|
Daytime on normal weekdays (07:00 – 19:00 hrs) between 24 August and 10 September 2018
Evening and night time on all days (19:00 – 07:00 hrs of the next day) and daytime during public holidays (including Sundays) (07:00 – 19:00 hrs) between 24 August and 10 September 2018 |
Leq (30 min) (logarithm average
of 6 consecutive Leq (5min)),
Leq (5 min), L10 (5min) & L90 (5min)
|
|
NM2 |
SENTX Site Boundary (North East) |
3.5
Monitoring Methodology
The monitoring procedures are as follows:
Ÿ The sound level meter was set at least 1.2 m above the ground for free-field measurements at monitoring stations NM1 and NM2. A correction of +3 dB(A) has been made for the free field measurements.
Ÿ The battery condition was checked to ensure good functioning of the meter.
Ÿ Parameters such as frequency weighting, time weighting and measurement time were set as follows:
- frequency weighting: A
- time weighting: Fast
- measurement time: 5 minutes (Leq (30-min) would be determined for daytime noise by calculating the logarithmic average of six Leq (5min) data)
Ÿ Prior to and after noise measurement, the meter was calibrated using the calibrator for 94.0 dB at 1,000 Hz. If the difference in the calibration level before and after measurement was more than 1.0 dB, the measurement was considered invalid and repeat of noise measurement was required after re-calibration or repair of the equipment.
Ÿ Noise monitoring was carried out continuously for 24 hours during the 14 days baseline monitoring period. Monitoring data were recorded and stored automatically within the sound level meter system. At the end of the monitoring period, noise levels in term of Leq, L90 and L10 were recorded. In addition, site conditions and noise sources were recorded when the equipment were checked and inspected every 2-3 days.
Ÿ All the monitoring data stored in the sound level meter system were downloaded through the computer software, and all these data were checked and reviewed on computer.
Ÿ Calibrated hand-held anemometer capable of measuring the wind speed in m s-1 was supplied for the measurement of wind speeds during noise monitoring periods.
3.6
Maintenance and Calibration
Maintenance and calibration procedures were as follows:
Ÿ The microphone head of the sound level meter and calibrator were cleaned with a soft cloth at quarterly intervals;
Ÿ The sound level meter and calibrator were checked and calibrated at yearly intervals; and
Ÿ Immediately prior to and following each noise measurement, the accuracy of the sound level meter should be checked using an acoustic calibrator generating known sound pressure level at known frequency. Measurements may be accepted as valid only if the calibration levels from before and after the noise measurement agree to within 1.0 dB.
3.7
Baseline Monitoring Results
Baseline noise monitoring was conducted at two monitoring stations (NM1 and NM2) between 24 August and 10 September 2018. The monitoring schedule is shown in Annex B2.
The baseline noise monitoring results are summarised in Tables 3.3 to 3.5. All baseline noise monitoring results are presented in Annex B3. Graphical presentations of the data are provided in Annex B4. The weather was generally sunny, cloudy and rainy during the baseline monitoring period. The noise level data which were affected by the rain were discarded when analysis to establish the action and limit levels. The operation of existing SENT Landfill and insect noises were noted as the possible influencing factors which may affect the baseline monitoring results.
Table 3.3 Summary of Noise Monitoring Results during Normal Working Hours (07:00-19:00 hrs; Normal Weekdays)
|
Normal Working Hours (07:00-19:00 hrs; Normal Weekdays) |
Measured Noise Level Leq (30 min), dB(A) |
||
|
Average |
Min. |
Max. |
|
|
NM1 |
56.5 |
48.5 |
69.4 |
|
NM2 |
61.3 |
57.2 |
68.2 |
Table 3.4 Summary of Noise Monitoring Results during Evening on Normal Weekdays (19:00-23:00 hrs) and Holidays (07:00-23:00 hrs)
|
Evening on Normal Weekdays (19:00-23:00 hrs) and Holidays (07:00-23:00 hrs) |
Measured Noise Level Leq (5 min), dB(A) |
||
|
Average |
Min. |
Max. |
|
|
NM1 |
56.8 |
46.5 |
72.7 |
|
NM2 |
60.0 |
56.7 |
69.1 |
Table 3.5 Summary of Noise Monitoring Results during Night-time (23:00-07:00 hrs of the next day)
|
Night-time (23:00-07:00 hrs of the next day) |
Measured Noise Level Leq (5 min), dB(A) |
||
|
Average |
Min. |
Max. |
|
|
NM1 |
54.7 |
46.6 |
70.4 |
|
NM2 |
58.1 |
56.6 |
69.8 |
3.8
Action and Limit Levels
The Action and Limit Levels were established in accordance with the updated EM&A Manual. The baseline noise level should be referenced during the compliance check during the impact noise monitoring period. Table 3.6 presents the Action and Limit Levels for construction noise of the Project.
Table 3.6 Action and Limit Levels for Construction Noise
|
Time Period |
Action Level (a) |
Limit Level (b) |
|
07:00 – 19:00 hrs on normal weekdays |
When one documented complaint is received from any one of the noise sensitive receivers (NSRs) or 75 dB(A) recorded at the monitoring station |
75 dB(A) at NSRs |
|
Notes: (a) 75dB(A) along and at about 100m from the SENTX site boundary was set as the Action Level. (b) Limits specified in the GW-TM and IND-TM for construction and operational noise, respectively. |
||
3.9
Event and Action Plan
Should non-compliance of the noise criteria occur, actions in accordance with the Event and Action Plan in Table 3.7 shall be carried out.
Table 3.7 Event and Action Plan for Construction Noise
|
Event |
Action |
|||
|
|
ET |
IEC |
Contractor |
|
|
Action Level |
· Identify the source(s) and investigate the cause(s) of exceedance and complaint · Prepare Notification of Exceedance within 24 hours · Inform Contractor, IEC and Project Proponent whether the cause of exceedance is due to the Project · Discuss with Contractor and IEC for remedial measures required · Ensure remedial measures are properly implemented · Have additional monitoring if exceedance is due to the Project. If exceedance stops, cease additional monitoring |
· Verify the Notification of Exceedance · Check monitoring data submitted by ET · Discuss with ET and Contractor on proposed remedial measures · Review proposals on remedial measures · Audit the implementation of the remedial measures · Audit the effectiveness of the implemented remedial measures |
· Submit proposals for remedial measures to IEC · Implement the agreed proposals
|
|
|
Limit Level |
· Identify the source(s) and investigate the cause(s) of exceedance and complaint · Prepare Notification of Exceedance within 24 hours · Inform Contractor, IEC, Project Proponent and EPD whether the cause of exceedance is due to the Project · Analyse the operation of SENTX and investigate the causes of exceedance · Provide interim report to Contractor, IEC, Project Proponent and EPD the causes of the exceedances · Discuss with Contractor and IEC for remedial measures required · Ensure remedial measures are properly implemented · Report the remedial measures implemented and the additional monitoring results to Contactor, IEC, Project Proponent and EPD · Have additional monitoring if exceedance is due to the Project. If exceedance stops, cease additional monitoring |
· Verify the Notification of Exceedance · Check monitoring data submitted by ET · Discuss with ET and Contractor on proposed remedial measures · Review proposals on remedial measures · Audit the implementation of the remedial measures · Audit the effectiveness of the implemented remedial measures |
· Take immediate measures to avoid further exceedance · Submit proposals for remedial measures to IEC within 3 working days of notification · Implement the agreed proposals · Resubmit proposals if problem still not under control · Stop the relevant activity of works as determined by the Project Proponent until the exceedance is abated
|
|
4
surface Water Quality
4.1
Monitoring Requirement
According to the updated EM&A Manual of the Project, baseline surface water quality monitoring shall be carried out at the two designated surface water discharge points (i.e. DP3 and DP4) for 3 days per week for 4 consecutive weeks prior to the commencement of construction works of the Project. Further details of the baseline surface water quality monitoring under this Project are presented in the following sections.
4.2
Monitoring Equipment
The measurements of pH, electrical conductivity (EC) and DO should be undertaken in situ. In situ monitoring instruments in compliance with the specifications listed under Section 4.2.2 of the updated EM&A Manual were used to undertake the surface water quality monitoring for the Project.
Table 4.1 summarises the equipment used in the baseline surface water quality monitoring works. Copies of the calibration certificates are attached in Annex C1.
Table 4.1 Surface Water Quality Monitoring Equipment
|
Equipment |
Model |
|
pH Meter |
Oakton pH 450 (S/N: 2607885) |
|
Electrical Conductivity Meter |
YSI Pro 30 (S/N: 17B101804) |
|
Dissolved Oxygen Meter |
Oakton DO 300 (S/N: 2105784) |
|
|
|
4.3
Monitoring Locations
Baseline surface water quality monitoring was conducted at one monitoring location (i.e. DP4) initially under the Project. For DP3, as confirmed by the FEP holder, given that there will not be any SENTX related construction works at the SENT Landfill restored area (i.e. the catchment of DP3 within the Project boundary) by 2021/2022 tentatively, baseline surface water quality monitoring at DP3 will be carried out before the actual commencement of construction works at the restored area affecting DP3 by 2021. Annex C4 shows the catchment area of DP3 with tentative construction. Baseline monitoring schedule for DP3 will be submitted to IEC and EPD (EIAO Authority) at least one week before the commencement of the monitoring as per Section 4.2.4 of the updated EM&A Manual.
Locations of the monitoring stations are shown in Figure 2.1.
4.4
Monitoring Parameters and Frequency
The monitoring parameters and frequency of the baseline surface water quality monitoring are presented in Table 4.2.
During the first two weeks of the 4-week monitoring between 6 and 31 August 2018, surface water monitoring was scheduled on Monday, Wednesday and Friday to fulfill the requirement that the interval between two sets of monitoring events should not be less than 36 hours. However, sampling could not be carried out for some scheduled events due to insufficient flow and surface water sampling was only carried out on 17 August 2018 at DP4.
In order to obtain more data to establish the baseline levels, sampling frequency was increased to daily whenever there was sufficient flow during the third and fourth weeks between 20 and 31 August 2018. Sampling was carried out daily at DP4 (except on 22 August 2018).
Available historical monitoring results between 2011 and 2018 were also used to establish the baseline levels which the upstream and surrounding conditions since 2011 were similar to the existing baseline conditions with the completion of restoration at the upstream areas and hence are representative of the baseline surface water conditions.
Table 4.2 Frequency and Parameters of Baseline Surface Water Quality Monitoring
|
Monitoring Station |
Location |
Frequency (a) |
Parameter |
|
|
DP4 |
Surface water discharge point DP4 |
17 August 2018, daily between 20–21, 23-24 and 27-31 August 2018 |
•pH •EC •DO •SS •COD •BOD5 •TOC •Ammoniacal–N •Nitrate-nitrogen •Nitrite–nitrogen •TKN •TN •Phosphate •Sulphate •Sulphide •Carbonate •Oil & Grease |
•Bicarbonate •Chloride •Sodium •Potassium •Calcium •Magnesium •Nickel •Manganese •Chromium •Cadmium •Copper •Lead •Iron •Zinc •Mercury •Boron |
|
Notes: (a) The 4-week monitoring period was between 6 and 31 August 2018. During the first two weeks, surface water monitoring was scheduled on Monday, Wednesday and Friday which the interval between two sets of monitoring was more than 36 hours. However, sampling could not be carried out for some scheduled events due to insufficient flow. In order to obtain more data to establish the baseline levels, sampling frequency was increased to daily whenever there was sufficient flow during the third and fourth weeks. (b) Available historical monitoring results between 2011 and 2018 were also used to establish the baseline levels for DP4. |
||||
4.5
Monitoring Methodology
4.5.1
Operating/Analytical Procedures
At the monitoring location, samples were obtained from the surface water body using an open mouthed polyethylene vessel with a lip. In situ measurements of DO level, DO Saturation, EC, pH and temperature were taken using in situ monitoring instruments. Samples were collected for laboratory analysis of parameters listed in Table 4.2. Following collection, water samples for laboratory analysis were stored in containers in appropriate type and size depending on the parameters to be analysed, packed in ice (cooled to 4°C without being frozen) and kept in dark during both on-site temporary storage and shipment to the testing laboratory. The samples were delivered to the laboratory as soon as possible and the laboratory determination works started within 24 hours after collection of the water samples. Sufficient volume of samples was collected to achieve the detection limit.
4.5.2
Laboratory Analytical Methods
The testing of parameters presented in Table 4.2 for all stations was conducted by ALS Technichem (HK) Pty Ltd. (HOKLAS Registration No. 066). Comprehensive quality assurance and control procedures were in place in order to ensure quality and consistency in results. The testing method and detection limit are provided in Table 4.4.
Table 4.4 Methods for Laboratory Analysis for Water Samples
|
Parameter |
Analytical Method |
Analytical Detection Limit (mg L-1) |
|
COD |
APHA 5220 B |
2 |
|
BOD5 |
APHA 5210 B |
2 |
|
Total Organic Carbon |
APHA 5310 B |
1 |
|
Sodium |
USEPA 6010C |
0.05 |
|
Potassium |
USEPA 6010C |
0.05 |
|
Calcium |
USEPA 6010C |
0.05 |
|
Magnesium |
USEPA 6010C |
0.05 |
|
Carbonate |
APHA 2320 B |
1 |
|
Bicarbonate |
APHA 2320 B |
1 |
|
Nickel |
USEPA 6020A |
0.001 |
|
Manganese |
USEPA 6020A |
0.001 |
|
Nitrate-nitrogen |
APHA 4500NO3: I |
0.01 |
|
Nitrite-nitrogen |
APHA 4500NO3: I |
0.01 |
|
Sulphate |
USEPA 375.4 |
1 |
|
Phosphate |
APHA 4500P: B & F |
0.01 |
|
Chloride |
USEPA 325.1 |
1 |
|
Sulphide |
APHA 4500S2-: D |
0.1 |
|
Chromium |
USEPA 6020A |
0.001 |
|
Cadmium |
USEPA 6020A |
0.0002 |
|
Copper |
USEPA 6020A |
0.001 |
|
Lead |
USEPA 6020A |
0.001 |
|
pH |
APHA 4500H+: B |
0.1 (pH unit) |
|
Electrical Conductivity |
APHA 2510 B |
1 (µS/cm) |
|
Iron |
USEPA 6010C |
0.04 |
|
Zinc |
USEPA 6020A |
0.01 |
|
Ammoniacal – nitrogen |
APHA 4500NH3: G |
0.1 |
|
Dissolved Oxygen |
APHA 4500O: C |
0.1 |
|
Oil & Grease |
APHA 5520 B |
5 |
|
Mercury |
USEPA 245.7 |
0.002 |
|
Boron |
USEPA 6020A |
0.01 |
|
TKN |
APHA 4500Norg: D |
0.1 |
|
Total Nitrogen |
APHA 4500Norg: D APHA 4500NO3: I |
0.1 |
|
Suspended Solids |
APHA 2540 D |
1 |
4.6
QA/QC Requirements
4.6.1
Calibration of In-situ Instruments
All in situ monitoring instruments were checked, calibrated and certified by a laboratory accredited under HOKLAS or other international accreditation scheme before use, and subsequently re-calibrated at 3 monthly intervals throughout all stages of the surface water quality monitoring programme. Responses of sensors and electrodes were checked with certified standard solutions before each use. Calibration for a DO meter was carried out before measurement according to the instruction manual of the equipment model.
For the on-site calibration of field equipment, the requirements of the BS 1427:1993, "Guide to on-site test methods for the analysis of waters" was observed.
4.6.2
Decontamination Procedures
Water sampling equipment used during the course of the monitoring programme was decontaminated by manual washing and rinsed with clean distilled water after each sampling location.
4.6.3
Sampling Management and Supervision
All sampling bottles were labelled with the sample ID (including the indication of sampling station), laboratory number and sampling date. Water samples were dispatched to the testing laboratory for analysis as soon as possible after the sampling. All samples were stored in a cool box and kept at less than 4°C but without frozen. All water samples were handled under chain of custody protocols and relinquished to the laboratory representatives at locations specified by the laboratory. The laboratory determination works started within 24 hours after collection of water samples.
4.6.4
Quality Control Measures for Sample Testing
The samples testing were performed by ALS Technichem (HK) Pty Ltd. The following quality control programme was performed by the laboratory for every batch of 20 samples:
Ÿ One method blank; and
Ÿ One sample duplicate.
4.7
Baseline Monitoring Results
Baseline surface water quality monitoring was conducted at one monitoring station (DP4) between 6 August and 31 August 2018. The detailed monitoring schedule is shown in Annex C2. The monitoring results at each monitoring station including the available historical monitoring results between 2011 and 2018 are shown in Annex C3. Graphical presentation of surface water quality (DO, SS and pH) at the monitoring stations is given in Annex C4.
During the baseline monitoring period, site clearance works were observed downstream of the DP4 sampling point during some monitoring events (24, 28 - 31 August 2018). These works were being undertaken by the TKO Area 137 Contractor in an area of the site still to be handed over to GVL. Considered the limited scale and location of the works, the impact on the surface water quality samples is anticipated to be insignificant. The baseline monitoring results are thus considered representative of the ambient surface water quality levels for DP4.
4.8
Action and Limit Levels
The Action and Limit Levels for DO, SS and pH are determined in accordance with requirements set out in the updated EM&A Manual which are summarized in Table 4.5. According to the Table 4.2a of the updated EM&A Manual, as the catchment of the new DP6 will be from the hillside, similar to the current DP4 catchment, the baseline data of DP4 will be used to set the Action and limit Levels for DP6.
Table 4.5 Guidelines for Establishing Action and Limit Levels for Surface Water Quality
|
Parameters |
Action Level |
Limit Level |
|
DO |
< 5%-ile of baseline data |
< 1%-ile of baseline data |
|
SS |
> 95%-ile of baseline data |
> 99%-ile of baseline data |
|
pH |
> 95%-ile of baseline data |
> 99%-ile of baseline data |
The Action and Limit levels for surface water quality impact monitoring are determined and presented in Table 4.6.
Table 4.6 Action and Limit Levels for Surface Water Quality
|
Parameters |
Action Level |
Limit Level |
|
|
DP4 & DP6 |
DP4 & DP6 |
|
DO |
< 5.80 mg/L |
< 5.42 mg/L |
|
SS |
> 11.7 mg/L (a) |
> 12.7 mg/L (a) |
|
pH |
> 8.39 |
> 8.40 |
|
Note: (a) SS data collected at DP4 on 17 Aug 2018 is considered outlier. This data is discarded and is not used to establish the Action and Limit levels. All the data including the discarded value will be reviewed and used as references during the future impact monitoring. |
||
4.9
Event and Action Plan
Should non-compliance of the surface water quality criteria occur, action in accordance with the Event and Action Plan in Table 4.7 shall be carried out.
Table 4.7 Event and Action Plan for Surface Water Quality During Construction Phase
|
Event |
Action |
|
||||
|
ET |
IEC |
Contractor |
|
|||
|
Action Level being exceeded by one sampling day |
· Repeat in situ measurement to confirm findings · Identify the source(s) and investigate the cause(s) of exceedance · Prepare Notification of Exceedance within 24 hours · Inform Contractor, IEC and Project Proponent whether the cause of exceedance is due to the Project · Repeat measurement on the next day of exceedance if exceedance is due to the Project
|
· Verify the Notification of Exceedance · Check monitoring data submitted by ET · Check Contractor's working methods |
· Rectify any unacceptable practice · Amend working methods if appropriate
|
|
||
|
Action Level being exceeded by two consecutive sampling days |
· Repeat in situ measurement to confirm findings · Identify the source(s) and investigate the cause(s) of exceedance · Prepare Notification of Exceedance within 24 hours · Inform Contractor, IEC and Project Proponent whether the cause of exceedance is due to the Project · Discuss with Contractor and IEC for remedial measures required · Ensure remedial measures are properly implemented · Increase the monitoring frequency to daily if exceedance is due to the Project and continue until no exceedance of Action Level
|
· Verify the Notification of Exceedance · Check monitoring data submitted by ET · Check Contractor's working methods · Discuss with ET Leader and Contractor on proposed remedial measures · Review proposals on remedial measures · Audit the implementation of the remedial measures · Audit the effectiveness of the implemented remedial measures
|
· Submit proposals for remedial measures to IEC · Implement the agreed proposals · Amend proposal if appropriate
|
|
||
|
Limit Level being exceeded by two consecutive sampling days |
· Repeat in situ measurement to confirm findings · Identify source(s) of impact and cause(s) of exceedance · Prepare the Notification of Exceedance within 24 hours · Inform Contractor, IEC, Project Proponent and EPD whether the cause of exceedance is due to the Project · Discuss with Contractor and IEC for remedial measures required · Ensure remedial measures are properly implemented · Increase the monitoring frequency to daily if exceedance is due to the Project until no exceedance of Limit Level
|
· Verify the Notification of Exceedance · Check monitoring data submitted by ET · Check Contractor's working methods · Discuss with ET and Contractor on proposed remedial measures · Review proposals on remedial measures · Audit the implementation of the remedial measures · Audit the effectiveness of the implemented remedial measures |
· Critically review the working methods · Rectify unacceptable practice · Check all plant and equipment · Consider changes of working methods · Discuss with the ET and IEC and propose mitigation measures to the IEC · Implement the agreed mitigation measures · Increase
|
|
||
|
Limit Level being exceeded by more than two consecutive sampling days |
· Repeat in situ measurement to confirm findings · Identify source(s) of impact and cause(s) of exceedance · Prepare the Notification of Exceedance within 24 hours · Inform Contractor, IEC, Project Proponent and EPD whether the cause of exceedance is due to the Project · Check monitoring data, all plant, equipment and Contractor’s working methods · Discuss with Contractor and IEC for remedial measures required · Ensure mitigation measures are implemented · Increase the monitoring frequency to daily if exceedance is due to the Project until no exceedance of Limit Level for two consecutive days
|
· Verify the Notification of Exceedance · Check monitoring data submitted by ET · Check Contractor's working methods · Discuss with ET and Contractor on proposed remedial measures · Review proposals on remedial measures · Audit the implementation of the remedial measures · Audit the effectiveness of the implemented remedial measures |
|
· Critically review the working methods · Rectify unacceptable practice · Check all plant and equipment · Consider changes of working methods · Discuss with the ET and IEC and propose mitigation measures · Implement the agreed mitigation measures · As directed by the Project Proponent, slow down or stop all or part of the construction activities
|
||
5
Landscape and Visual
5.1
Monitoring Requirement
According to the updated EM&A Manual of the Project, the landscape and visual baseline will be determined with reference to the habitat maps included in the approved EIA Report taken into account of the latest design and Tree Survey Report as well as site conditions verification surveys. The site conditions verification surveys were conducted in August and September 2018 to verify if there is any major change to the landscape and visual conditions with reference to the approved EIA Report. Further details are presented in the following sections.
5.2
Monitoring Methodology
Site conditions verification surveys were conducted in August and September 2018 around the Project area. In particular, the Landscape Resources (LRs) and Landscape Character Areas (LCAs) for the Project identified in the approved EIA Report (Figure 10.5b-e and Figure 10.5g-h of the approved EIA Report refer) were revisited as far as practicable to verify if there is any major change of landscape baseline with reference to the approved EIA Report.
5.3
Monitoring Results
5.3.1
Landscape Resources (LRs)
LRs were identified during the EIA stage. The site conditions verification surveys were conducted in August and September 2018 and these LRs were revisited as far as practicable. The detailed descriptions of the LRs presented in the approved EIA Report and the updated baseline conditions are summarised in Table 5.1:
Table 5.1 Landscape Resources
|
|
Approved EIA report |
2018 Baseline |
|
LR1 |
Shrubs and topography on Fat Tong Chau Hillside |
|
|
LR2 |
Trees and shrubs in TVB City of Tseung Kwan O Industrial Estate |
|
|
LR3 |
Shrubs in Hong Kong Aircraft Engineering Building, TKO Industrial Estate |
|
|
LR4 |
Trees along Chun Wang Street |
|
|
LR5 |
Trees along Wan Po Road |
|
|
LR6 |
Drainage channel in TKO Area 137 |
|
|
LR7 |
Trees in northern part of TKO Area 137 |
|
|
LR8 |
Coastal water east of TKO Area 137 |
|
|
LR9 |
Shrubs in southern part of TKO Area 137 |
|
|
LR10 |
Stream on Fat Tong Chau Hillside |
|
|
LR11 |
Trees and shrubs along lower hillside of Tin Ha Shan |
|
|
LR12 |
Site office area of SENT Landfill |
|
|
LR13 |
Plantation and topography in South SENT Landfill |
|
|
LR14 |
Plantation and topography in South-East SENT Landfill |
Access road and topography in South-East SENT Landfill |
|
LR15 |
Plantation and topography in West SENT Landfill |
|
|
LR16 |
Grassland and topography in SENT Landfill |
Shrubs and topography in SENT Landfill |
|
LR17 |
Man-made slope with shrubs and grass in SENT Landfill |
|
|
LR18 |
NOT USED |
|
|
LR19 |
Trees, shrubs and topography in Ha Shan Tuk |
|
|
LR20 |
Shrubs and topography in Tin Ha Shan |
|
|
LR21 |
Streams in Tin Ha Shan |
|
|
LR22 |
Trees, shrubs and topography in Tin Ha Au |
|
|
LR23 |
Shrubs and Topography in Lower ridge east of TKO Area 137 |
|
|
LR24 |
Grass, shrubs and topography on upper ridge east of TKO Area 137 |
|
|
LR25 |
Sandy shore south of ridge east of TKO Area 137 |
|
|
LR26 |
Streams in Tin Ha Au |
|
|
LR27 |
Sandy shore off Tin Ha Au |
|
|
LR28 |
Coastal water off Tin Ha Au |
|
The updated baseline conditions with photos of the LRs are presented in Annex D1. During the site conditions verification surveys, change of landscape resource / element was identified at LR14 and LR16. The plantation in South-East SENT Landfill at LR14 was eradicated and turns into an access road for the existing SENT Landfill within the SENTX site boundary. While the vegetation (grassland) at LR16 becomes more mature with a larger area of shrubs compared to that presented in the approved EIA Report.
5.3.2
Landscape Character Areas (LCAs)
LCAs were identified during the EIA stage. The site conditions verification surveys were conducted in August and September 2018 and these LCAs were revisited as far as practicable. The detailed descriptions of the LCAs presented in the approved EIA Report and the updated baseline conditions are summarised in Table 5.2:
Table 5.2 Landscape Character Areas
|
|
Approved EIA report |
2018 Baseline |
|
LCA1 |
Fat Tong O Reclamation |
|
|
LCA2 |
Tseung Kwan O Industrial Estate |
|
|
LCA3 |
SENT Landfill |
|
|
LCA4 |
Fat Tong Chau Headland |
|
|
LCA5 |
Clear Water Bay Peninsular Central Coastal Uplands |
|
|
LCA6 |
Tathong Channel |
|
The updated baseline conditions with photos of the LCAs are presented in Annex D2. During the site conditions verification surveys, no major change of landscape character area / element was identified.
5.4
Summary
Base on the results of the site conditions verification surveys conducted in August and September 2018 with reference to the LRs and LCAs identified in the approved EIA Report, it is concluded that the landscape and visual baseline conditions is similar to those presented in the approved EIA Report, except LR14 and LR16. The observed deviations of the actual baseline conditions from the predicted baseline at LR14 and LR16 as shown in the approved EIA Report are considered minor and do not significantly alter the overall landscape and visual baseline condition. Therefore, the landscape and visual impact assessment as presented in the approved EIA Report is considered valid. Additional landscape and visual mitigation measures other than those recommended in the approved EIA Report are thus not required.
6
Conclusion
In accordance with the updated EM&A Manual of the Project, baseline monitoring was undertaken prior to commencement of the construction works for the following baseline monitoring components:
Ÿ Air Quality (construction dust is the key concern during the construction phase);
Ÿ Noise;
Ÿ Surface water Quality; and
Ÿ Landscape and Visual
Air quality monitoring of dust was conducted at two monitoring stations (DM1 and DM2) under the on-going EM&A programme TKO Area 137 Fill Bank. The recent one year historical data taking account of the seasonal variations are considered representative to the ambient air quality conditions of the sensitive receivers in the vicinity of the Project. The Action and Limit Levels for dust (24-hour TSP levels) were established.
Baseline noise monitoring was conducted at two monitoring stations (NM1 and NM2) between 24 August and 10 September 2018. The major noise sources identified at the monitoring stations are the noise from the operation of the existing SENT landfill and insect. The baseline monitoring results are considered representative of the current ambient noise level.
Baseline surface water quality monitoring was conducted at one monitoring station (DP4) between 6 August and 31 August 2018. Site clearance works were observed in the vicinity of DP4 during some monitoring events at the downstream of DP4. Considered the limited scale and location of the works, the impact on the surface water quality samples is anticipated to be insignificant. The baseline monitoring results are thus considered representative of the ambient surface water quality levels. Action and Limit Levels for dissolved oxygen (DO), suspended solids (SS) and pH were established based on the baseline monitoring results.
Site conditions verification surveys for landscape and visual baseline were conducted in August and September 2018 to revisit the identified Landscape Resources (LRs) and Landscape Character Areas (LCAs) in the approved EIA Report. The survey results concluded that the landscape and visual baseline conditions is similar to those presented in the approved EIA Report, except LR14 and LR16. The observed deviations at LR14 and are considered minor and do not significantly alter the overall landscape and visual baseline condition. Additional landscape and visual mitigation measures other than those recommended in the approved EIA Report are thus not required.